Archive for month: September, 2014
A Falling Bond Playbook
A Falling Bond Playbook
Yesterday I talked about how both stocks and bonds could decline if we see a material pullback in the market. Given most of us are “long” both, that’s a little concerning, seeing as they historically tend to hedge each other. Bonds are bouncing today, but I wanted to provide a bit of a “playbook” so people can have a plan in place, if we start to see bonds/stocks sell off materially.
1. The “Right” Way to Short Bonds
2. Active Sector Selection
3. Long Japan and Europe, Short Emerging Markets
Sign up for a free trial on the right hand side of this page to get our specific ETF portfolio.
It’s All About Considerable Time
Bottom Line—It’s About “Considerable Time”
If there was one specific reason stocks have traded “heavy” for over a week now (Friday’s rally aside), it’s Fed expectations. This market remains Fed-dominated, plain and simple. And, levels of Fed angst are slowly on the rise as we near the Sept. 17 FOMC meeting.
In particular, there is the worry that the Fed will remove the term “considerable time” from the official statement. This “considerable time” pertains to when the Fed will raise rates after QE stops this October. So, the current statement says the Fed won’t raise rates for a “considerable time” after QE ends in October.
But, quietly there has been a movement gaining steam in the FOMC to remove that phrase from the statement. If that happens next Wednesday, it’ll be taken as mildly “hawkish” because logically markets will assume rates will rise sooner than later.
That growing expectation, along with the apparent break in the European bond buying fever, is what’s weighing on Treasuries and stocks—and it underscores a very important point.
If we are in for a sell off/correction of some sort, then it likely will come with both stocks and bonds going down—so the expectation that even if stocks drop we can hide in bonds will no longer be valid in the short term – assuming this bond rally of 2014 really has broken (which I believe it has).
Bottom line is you have to respect this rally, but this market continues to feel heavy to me. I would not be adding any new long exposure here. JNK continues to be under pressure (down again yesterday and well below 41.00) and I maintain that is a leading indicator, and because there are so many “late longs” in this market that begrudgingly added long exposure during the last three weeks, the potential for a very ugly day between now and the FOMC meeting next Wednesday is on the rise.
Sevens Report Chart of the Day by Analyst Tyler Richey
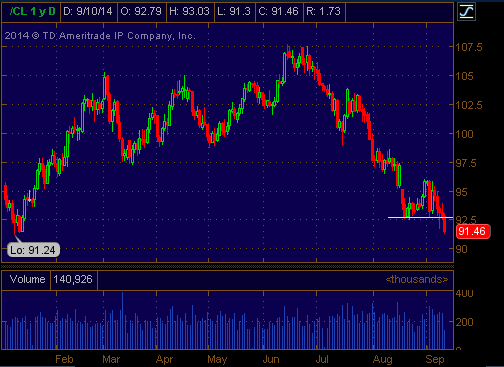
Crude oil futures are extending losses this morning after the EIA reported largely bearish inventory data. See results below.
WTI Crude Oil: -1.0M barrels vs. (E) -1.2M barrels
RBOB Gasoline: +2.4M barrels vs. (E) Unchanged
Distillates: +4.1M barrels vs. (E) +600K barrels
What Is the Investor Intelligence Survey Telling Us About the Stock Market?

Sign up for a free trial on the right hand side of this page to learn more!
Are Junk Bonds Forecasting a “Top” in the Stock Market Again?
Even though the fundamental backdrop is favorable for stocks, the inevitability of a continued market rise is palpable. The “Pain Trade” is now clearly lower for both stocks and bonds.
JNK, the junk bond ETF, accurately forecasted the July/early August decline in the stock market. Now, it’s rolling over again—providing a potential warning sign that we may be in for another dip.
Enter your email address on the right so we can send you today’s report with our analysis on Why Junk Bonds May Be Forecasting Another Correction in the Stock Market and begin a two week free trial to The Sevens Report.
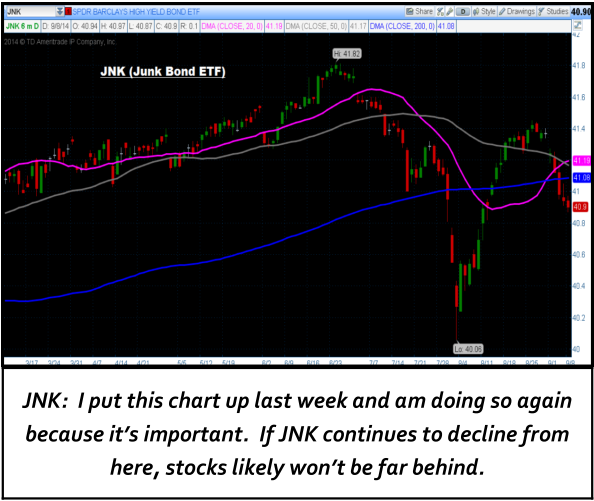
JNK Is Rolling Over – That Is a Warning Sign
JNK Is Rolling Over—That is A Warning Sign
JNK, the junk bond ETF, accurately forecast the July/early August decline in the stock market. Now, it’s rolling over again—providing a potential warning sign that we may be in for another dip.
In the July 22 issue of the Report, we included a chart that showed how junk bonds had broken a 2014 uptrend, and warned it could be a negative sign for stocks.
Likewise, we kept watching JNK as the leading indicator for the stock market during the late-July/early August sell-off. We pointed out on Aug. 13 that JNK was close to breaking back above resistance at $41 and, if successful, could signal an end to the stock sell-off. JNK did break resistance, and over the next week the S&P 500 rallied 50 points in a straight line …
So, to recap:
- JNK topped on 6/23/14.
- SPY basically topped on 7/3, 11 days after JNK. (The SPX did make a nominal new high on 7/24 but really the market was chopping for those three weeks.)
- JNK declined -4.21% peak to trough, bottoming on Aug. 1.
- SPX declined -4.25% peak to trough and bottomed on 8/7, one week after JNK.
So, JNK peaked and bottomed one week before SPY, and the declines were almost identical.
And, while nothing in the market is 100% guaranteed, it sure seems like JNK acted as a leading indicator for stocks.
And, that makes sense fundamentally. If we are going to see a decline in stocks, it’s going to be due to fears about the Fed getting too hawkish, which will come with higher rates. And, when rates do start to rise, junk bonds will get hit the hardest because they are the sector of the bond market that is the most overbought, thanks to years of QE and the subsequent reach for yield.
Turning to the present, JNK is rolling over, as the chart on pg. 1 shows. JNK peaked on 8/26 and is now down 4 days in a row, again below support at the $41 level.
Point being—JNK acted as a leading indicator for stocks 2 months ago, and I believe it’s continuing to do so now. Does that make me outright bearish on stocks? No, you can’t fight this tape and have to respect the rally. But, it is a warning sign we need to monitor, and it may be an indication that we’re in for another sell-off in the coming weeks.
2 Reasons We May Be In for Another Sell-Off
2 Reasons We May Be In For Another Sell-Off
Even though the fundamental backdrop is favorable for stocks, the inevitability of a continued market rise is palpable. The “Pain Trade” is now clearly lower for both stocks and bonds.
There were three pieces of anecdotal evidence yesterday to support my opinion (although, obviously, anecdotal evidence has to be taken with a grain of trading salt). First, I read that the Investors Intelligence sentiment survey, released last week, showed just 13.3% of those surveyed were bearish—which is the lowest since 1987.
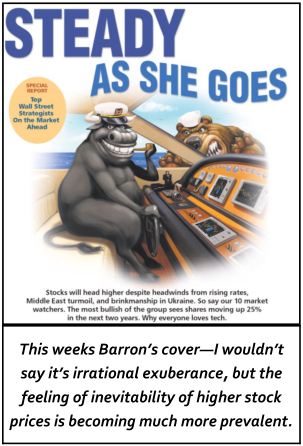
Second, the cover of Barron’s was bullish. The cover story—which was about a survey Barron’s conducted involving the Chief Investment Strategists from 10 large investment managers—found that not one of them was bearish. Now to be fair, Barron’s isn’t a mainstream publication and obviously has a more sophisticated readership than the average investor. Nonetheless, it again speaks to the inevitability of higher stock prices.
Finally, Deutsche Bank Strategist David Bianco, an ardent bear for all of 2014, has now switched and introduced a 2,050 target for the S&P 500 (previously 1,850), along with 2,150 for 2015 (previously 2,000) and 2,300 for 2016.
Again, none of these things mean equities are about to roll over, and I’m certainly not becoming bearish on stocks. And, yes there remains healthy skepticism for the reasons stocks are rallying (the most common is a Fed-induced bubble). But for the first time in a long time, people seem very comfortable with stocks inevitably grinding higher. Yesterday’s midday sell off came with little to no fanfare – and even if there is a small dip, everyone has plans to buy it.
Again, anecdotal evidence needs to be taken with a grain of salt—but I’m just saying there has been a shift in sentiment, and the pain trade is definitely to the downside.