Is Dis-Inflation Good For Stocks?

Yesterday was a pretty quiet day in the markets, but one consistent theme that showed up in economic data releases was something we’ve been ahead of the curve on here—and that’s the creep of dis-inflation and potential for deflation (Bloomberg had an article on it yesterday, link here), and I might add two weeks after we started pointing out the commodity crash was forecasting deflation).

Of particular note yesterday, then, was the latest release of the PCE Price Index, which is contained in the Personal Income and Outlays Report.

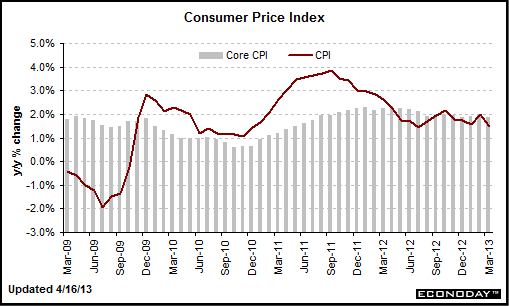
The PCE Price Index is a measure of inflation – but this one is extra important, because the PCE Price Index is widely assumed to be the Federal Reserve’s favorite measure of inflation.  For March, the PCE Price Index rose only 1% year over year, with the “Core” PCE Price Index rising just 1.1% year over year (core excludes energy and food prices).

1% year-over-year inflation sounds great – but it isn’t.  In fact, it’s something to be worried about.  The Fed wants the year-over-year change in the PCE price index to be around 2%; that’s the level that is seen as healthy inflation.

But, 1% year-over-year increases in PCE Price Index is close to disinflation, which is really one step away from outright deflation – and that is really, really bad for the markets, economy, and risk assets.

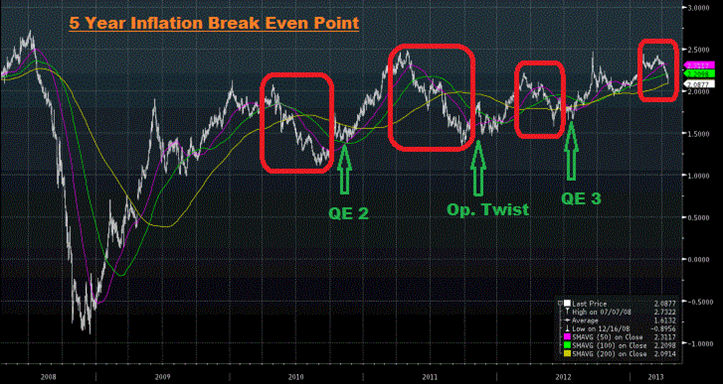
The reason stocks were up yesterday is because that low reading on the PCE Price Index is seen as making the Fed continue its QE program for the foreseeable future.  With inflation running so low, the view is that there’s no way the Fed would tighten policy and risk sparking deflation.

This trend is not exclusive the U.S.  Yesterday, German CPI showed a 0.5% month-over-month decline in prices, and year over year, CPI rose just 1.2%.  In Spain, prices rose just 1.5% year over year, falling sharply from last month’s 2.6% year-over-year gain.  All of these year-over-year increases are 1) heading in the wrong direction, meaning the are going lower each month, and 2) well below the 2% inflation considered healthy by the ECB.

Markets have rallied since last week, despite the bad economic data, because it’s assumed the ECB and Fed will become even more accommodative to combat growing dis-inflation and potential deflation.  So, we’re back to this perverse logic where increasing signs of deflation (which is really bad) is somehow good for stock prices in the immediate term because it promises constant QE and interest rate cuts.

But, while it has supported markets for over a week, this is not what we want.  More QE is not good for the market in the medium/longer term.  We have had enough QE!  We need old-fashioned economic growth now—and the longer we go on without it, the greater the negative risks of QE programs become.

Getting bullish of stocks now, because of the prospects of more QE in reaction to a growing global deflation problem, is like hoping you catch pneumonia so you can stay home from school because you’re unprepared for a test.  Yes—it solves the immediate problem in that you skip the test, but the risks of something bad happening simply aren’t worth it.  The key to substantially higher stock prices over the medium term and longer term, and an economy that can actually grow at more than a snails pace for more than a few weeks, is less QE and more inflation—not more QE and deflation.

Four Major Market Moving Events to Watch This Week

Economics

Last Week

Economic data was almost universally disappointing last week, although it obviously didn’t have the expected effect on the market (more on why below).

The big numbers of last week, the global flash PMIs, all either missed expectations (China, U.S. and Germany) or met low expectations and remained below 50 (EMU), signaling contraction.  The flash manufacturing PMIs certainly showed that the slowdown in growth in the global economy seen in March has so far carried over into April.

The durable goods number was also soft, as new orders for non-defense capital goods ex. aircraft (NDCGXA) increased slightly in March, but only after February data was revised lower.  This implies that along with the consumer, businesses scaled back spending and investment in March.

In Europe, the German IFO survey also missed expectations, and between that and Germany’s weak manufacturing PMI, evidence is mounting that shows the mighty German economy is finally being dragged down by the rest of Europe.

Finally, Q1 U.S. GDP was a bit of a mixed bag.  Negatively, the headline showed 2.5% annual growth in Q1 vs. (E) 3%, and final sales of domestic product, which is GDP less inventories, rose 1.5%.  (It’s helpful to exclude inventories because big inventory accumulation subtracts from next quarter’s GDP as de-stocking occurs).

Positively, PCE, personal consumption expenditures, beat estimates at 3.2%, so the consumer kept spending in Q1, although that’s being discounted a bit because of the soft March retail sales data.

So, bottom line on GDP is we remain in a very slow growth economy, just as we’ve been for the last several years.

This Week

This is a very important week, plain and simple.  First, final readings of global manufacturing PMIs are released Tuesday night (China) and Wednesday morning (Europe & U.S.).  While some of the power is taken out of these numbers given the flash estimates from last week, they will still move markets.

Second, it’s jobs week.  Friday brings the April jobs report, but before then we’ll have the ADP report Wednesday, and weekly claims and the Challenger layoff report Thursday.

Third, and most importantly, the Fed, ECB and Bank of England all have interest rate meetings Wednesday (Fed) and Thursday morning (ECB and BOE).

These meetings are the most important events of the week.  Markets didn’t decline on the weak economic data from last week due to the perception (and expectation in the case of the ECB) that central banks are going to either stay the course with current QE programs and other accommodation, or become more accommodative.  That expectation makes the weak data from March/April somewhat irrelevant, because if CBs stay “easy” or get “easier” it’s assumed that the weak economic data will just be a bump in the road of a greater recovery.

The ECB in particular will be the most watched CB this week.  A 25-basis-point rate cut is fully priced in at this point, so at a minimum that’s what the market is expecting.  I’ll preview it more when we get closer, but the ECB better reveal unconventional easing measures or strongly hint they are on the way, otherwise there will be some substantial disappointment.

At the Fed, the tide appears to be turning with regard to the discussion about ending QE this year.  Given the soft economic and inflation data recently, the market will be looking for some “dovish” commentary from the Fed about being committed to keeping QE on as long as necessary.

As stated, this week is very important from a macro perspective.  The bad economic data was overlooked last week because of expectations for central banks; now they need to deliver (or the data needs to get better).

The Russell 2000 and Dow Transports are Fast Approaching

SevensReport_Chart_4.25.13

The Russell 2000 and Dow Transports are fast approaching the pre-selloff levels from last week, so a break above 6143 in the Dow Transports and 938 in the Russell 2000 would be significant.  The SXPP could rally for a while before it even gets to the downtrend, given the absurd weakness in that index, but nonetheless if the rally continues that’s worth noting.

The Real Reason Stocks Rallied Yesterday

Economic data has been the main driver of the market lately, and yesterday pretty much all the economic data we received missed expectations. Chinese, EMU, German and U.S Flash Manufacturing PMIs all either declined from last month and missed expectations, or stayed at the same levels as last month but still signaled contraction in the manufacturing sector.

So, with the economic data so bad—why did stocks rally yesterday?

The answer is changing market expectations of Europe. Keep in mind that the market is a discounting mechanism—it’s always trying to factor in future occurrences in today’s prices. Yesterday, the markets expectations of some potential future events in Europe trumped the reality of weak economic data.

In particular, the market rally yesterday, which was led by European markets, was based on the fact that there is a growing belief (supported by some evidence) that Europe will abandon its multi-year campaign of austerity for PIIGS countries (which has led to stagnant economic growth in the EMU) and instead focus on fostering economic growth.

Additionally, yesterday’s bad economic data in the EMU was seen as increasing the chances of the ECB cutting rates next week, which the market views as a economic positive for the region.

All this relates back to the markets main concern and the catalyst for the recent correction, which is the stalling of global economic growth and the creeping of deflation, which is emanating from Europe.

The reasoning for yesterday rally goes something like this:

If Europe abandons austerity and starts to foster economic growth, and if the ECB not only cuts interest rates but also does additional, unconventional easing measures like a new LTRO or even QE, then the ECB will finally join the Bank of Japan, Bank of England and Fed in being ultra accommodative and directly combating deflation and spurring economic growth.

If this actually happens, and the EU and the ECB actually follow through with measures designed to stimulate growth, then it is a bullish game changer—and in that scenario you would want to buy European markets with both hands, similarly to how we should have bought the S&P at the start of QE2 and how we bought DXJ when Abe was elected. It’s very, very similar—if it comes to fruition.

Keep in mind, though, there are a lot of “ifs” that are assumed in that statement—and while several articles are hailing the end of austerity in Europe and calling for a rate cut, those of us who have traded this crisis from the beginning are well aware of European Leader’s multiple “false starts” with regards to taking steps to resolve the crisis.

From a “how do we know” standpoint, we should continue to watch the SXPP (STOXX Basic Materials Index) to see if it can bottom, and the ECB meeting next week to see 1) If they even do a rate cut (its not certain) and 2) If they reference any unconventional measures are being considered.

I for one will continue to be cautious, as there will be plenty of money to be made being long Europe if and when the tide turns and the EU and ECB are ready to embrace economic growth.

This Chart Shows Why Stocks Are Rallying

Bunds Spanish Spread

The U.S. Economy Showing Signs of a Slowdown – Again. Here’s What to Watch This Week.

Economics

Last Week

The main takeaway from last week, from a data perspective, is that the slowdown in domestic growth we saw in March is extending into April.  Pretty much every data point from last week showed a slowdown in economic activity.

The Empire Manufacturing Survey and Philly Fed Index, two of the first data points from April, both missed expectations, and importantly the New Orders component for both declined, implying more weakness ahead.

The other two big data points of the week, Industrial Production and Housing Starts, also showed some moderation in the pace of growth, despite the headlines for both numbers beating expectations (IP was higher because of utility output, while housing starts beat because of multi-family starts, neither which are really positive).

Finally, jobless claims were “OK” but importantly they have broken the downtrend they were in throughout late February/early March, implying the positive momentum in the jobs market has stalled.

Finally, the most damaging data this week came on Monday, when Chinese GDP missed expectations, and industrial production and retail sales were also weak.  Plus, housing prices continued to rise in major metropolitan areas, increasing the likelihood of more measures being announced to curb rising property prices.

Bottom line is that one of the major concerns of the market, and one of the reasons for the fall in equity prices this week, has been the return of another “Spring dip” in economic activity, and data this week only reinforced that fear.

This Week

The focus remains on global economic growth this week and by far the most important numbers will be the Flash Manufacturing PMIs out tonight and tomorrow.  Chinese PMI comes tonight and the EU and US figures will be released Tuesday morning.

Even without the PMIs it is a relatively busy week from an economics perspective.  The second most important number behind the PMI is Durable Goods, out Wednesday. Retail sales lately have disappointed, implying some softening in consumer spending, so business spending will be closely watched to see if it too is declining.

The first look at Q1 ‘13 GDP is Friday, although this number, which will be good, isn’t quite as important as you would think because the focus now is on the moderation of growth in March and now April (GDP reflects the entire quarter, so Jan/Feb will skew the number higher than what the economy is currently doing).

Weekly jobless claims will be watched to see if the downtrend from February/March can resume, and there’s existing and new home sales (Monday and Wednesday), which will give us a bit more color into the state of the housing market (the numbers should show continued strength in pricing and low inventories).

Internationally, away from the Flash Manufacturing PMIs early in the week, it’s somewhat quiet.  There is a Bank of Japan meeting Thursday, but after the “shock and awe” from the April meeting, not much new is expected. UK GDP is released Thursday as well.

Bottom line is that economic growth remains the key issue in markets.  The Flash manufacturing PMIs are by far the most important number of the week, and depending how they go, it may well decide whether this correction stalls or accelerates.


This Is the Leading Indicator for All Markets

Picture4

SXPP:  This index remains the leading indicator for all markets, as it is one of the best real time indicators of global economic growth. 


Indices to Watch Today – Part II

What Does the Commodity Meltdown Mean?

The declines in gold and silver yesterday were astonishing.  In 10+ years of watching both metals trade every day, I’ve never seen that type of decline.  In addition to gold and silver collapsing again, every single commodity on my screen was lower, with the exception of orange juice.

This commodity rout is important as it’s the biggest thing occurring in any market right now.  I touched on it some yesterday, but I want to review it more in depth today to make sure everyone knows what’s happening and what it means.  I believe what’s happening in the commodity space presents a binary outcome for all asset classes, and I want to make sure everyone knows the two ways this is going to work out.

Theory  No. 1—The Return of the “Real” Economy.

The first theory is a bullish one:  The reasoning goes that gold and silver are declining because we are on the cusp of another period of real economic growth and technological advancement that will see equities rally substantially as the real economy finally kicks into gear after years of stagnation.  That expectation is causing a rotation out of inflation and crisis-linked commodities like gold, and into more economically sensitive assets like stocks, which will benefit from the new momentum in the economy.

This theory is certainly possible, but there are a few problems:  First, if we are on the cusp of a period of economic advancement, then why are all commodities getting killed, including economically sensitive commodities like oil, copper, steel, gasoline, palladium and others?  The answer to that question seems to be increased supply—and that increased supply is causing wholesale rotation out of commodities and into stocks.  That is a fair argument and very well may be true.

But, there is one other chink in the armor of Theory No. 1.  If we are on the cusp of a new period of economic expansion, then why aren’t bonds falling?  Bonds have been rising since March, and if we’re about to see the real economy kick into gear for the first time in 4+ years, bonds should be falling like a stone—but they aren’t.  One possible explanation is that money flows from Europe and Japan are holding bonds up, but I haven’t seen enough evidence to tell me that’s the case.

What do we do if this theory is true:  You buy U.S. stocks with both hands, and sell any commodity exposure and reduce bond holdings.

How will we know if this is the right theory:  You’ll know because 1) bonds will crack, 2) economic data will accelerate, and 3) corporate profits and outlooks will get better (none of which is happening now).

Theory No. 2:  The Deflation Theory

The second theory is a deflation theory.  With gold and silver imploding and industrial commodities (in fact all commodities) declining rapidly, and U.S. Treasurys and German Bunds rallying throughout March, markets are telling us the global economy is very close to entering a period of deflation.  Europe is dangerously close (if not already in) deflation, Japan is still in deflation, and Chinese and U.S. economic growth is slowing.

The “deflation trade” is occurring in commodities (especially gold and silver) first as money flows out of commodities its flowing into bonds.

This theory also makes sense, except for one thing—the equity market is still rising.  Stocks are rallying in the face of a commodity collapse and higher bond prices, and that shouldn’t happen in a deflationary environment.

One possible answer to why this is happening is money flows.  Investors are continuing to buy into stocks because they “have to” because of the Fed, which is propping up the stock market despite significantly deteriorating fundamentals.

What do we do if this theory is true:  You get defensive.  We buy bonds and reduce equity exposure and raise cash, because if this theory is true, stocks are going to fall, and fall very hard.

How will we know if this theory is true:  You’ll know because the equity market will break from its highs and bonds will continue to rally to new highs.

I want it to be Theory No. 1, but my gut is afraid it’s Theory No. 2.  Not to sound like a loon, but the last time I saw commodity carnage like this was in July/August of 2008.  I’m not saying there is going to be another financial crisis (I don’t think there will be) but I’m just pointing it out.

Finally, a lot of markets simply aren’t making sense right now—if we’re in a new golden age of economic expansion why aren’t bonds falling?  If we’re in deflation, why aren’t stocks falling? How the hell have bonds and stocks been rising together for the last seven weeks?   When things don’t make sense like this, I’ve never seen it end with a melt-up in the market.  I hope that this time I’m wrong.

One more thing—if Theory No. 2 is the correct one, I think this ultimately ends with more Fed easing, which will be good for gold, which means that at some point there will be a buying opportunity (I don’t think it’s now, too much technical damage has been done and the commodity needs to settle a bit).

Picture6

The chart above shows the five-year inflation expectations of the market.  As you can see, they’ve declined sharply over the past several weeks.  I’ve highlighted previous times the inflation expectations have seen a significant decline, and each time its been met with more Fed easing.  If the declines in inflation expectations continue, that means deflation, and the Fed will ease more in the coming months, not tighten.  This remains an important indicator to watch.

Transports and Russell 2000 — Indices to Watch Today

Picture2

Lower Lows:  Dow Transports and the Russell 2000 have led this market higher since last July, yet both made lower lows yesterday, a bearish sign.


Commodities in Freefall and What it Means

Picture3

Commodities

Commodities declined sharply last week, as the broad-based commodity ETF DBC declined more than 1%, with most of the weakness coming on Friday.  The ETF and most commodity indices moved to multi-month lows, implying more weakness ahead.

The decline in commodities came despite a weaker dollar and generally “OK” global economic data. Continued rotation out of the commodity space by investors was the main catalyst for the declines.

Gold imploded last week, falling 5% on Friday alone and 6% for the week.  The reasons for the weakness in gold are the same as they have been:  negative momentum and money rotation out of gold due to a reduction of risk globally and a total lack of inflation (and potential threat of deflation in Europe).

The one main catalyst for Friday’s decline, however, was the report that Cyprus will have to sell some of its gold (or pledge it as collateral against EU loans), which sets a significant precedent and obviously got gold longs very nervous.

Despite a very low speculative net long position and a rising monetary base, money flows are trumping fundamentals and clearly there is very heavy negative momentum in gold.  I was very, very surprised by the waterfall decline Friday, and clearly the technical damage done was significant.

What to do with gold now depends on your time horizon.  I, for one, continue to see all signs pointing to inflation over the longer term, thanks to continued central bank accommodation and excess liquidity.  I’m very confident inflation will be a problem in the future, and as such I would/am not selling longer-term gold holdings.  With gold and silver plunging again this morning we are in the midst of a sellers panic at this point, although I’m hearing there is decent support in the mid $1300’s.  Silver and copper also declined sharply last Friday and this morning in sympathy with gold, and both finished lower on the week (with silver hitting new 52-week lows).

Energy declined last week as WTI Crude broke through support at the $91/bbl. level and Brent crude fell basically to previous lows for the year.  Both commodities were pressured by general commodity market weakness.

Finally, grain markets were the outperformers last week as the entire complex rallied, bouncing from an oversold condition after a USDA World Agricultural Supply/Demand Estimate report showed that the supply of corn and soybeans hadn’t grown as much as thought (the report wasn’t bullish, it just wasn’t as bearish as feared).  Given the number of shorts in the grains, that led to a short covering rally, although the supply/demand picture remains uncertain and given the planting intentions for this year, it’s not certain that you’re buying “value” in the grains at these levels.

The weakness in the commodity markets remains an important topic to monitor.  On one hand, you can make the case the decline is justified, given recent supply increases in commodities like copper, WTI Crude and steel.  But, while those supply increases are totally legitimate, they are overshadowing the weakness in the global economy, which is something I think needs to be considered.

Commodities as an asset class are signaling one of two things:  1) That we are returning to a period like the 1980s where increased supply, reduced macroeconomic uncertainty and low inflation depresses commodity prices, and we see a renewed equity bull market where stocks significantly outperform commodities.  Or, 2) the weakness in commodities is signaling trouble on the macroeconomic horizon, as global growth stagnates and we all flirt with another bout of global deflation (which would better explain gold’s weakness than just money flows).  Scenario No. 1 is equity market positive, scenario No. 2 is very equity market negative.

I don’t know which it is, but it is one of the two.  I hope it’s the former, but I fear it’s the latter– as I still can’t get it through my head how we all get global economic growth without stimulating massive inflation across the globe.  The path out of this multi-year, global economic malaise is through economic growth and inflation—that’s what we should all want to happen—but commodities are telling us it isn’t happening.  And, while I hope we’re embarking on an 1980s-style equity bull market, I just can’t see how at this point.